


Understanding partisan gerrymandering (part III): calculating partisan gerrymandering

See Part II for additional explanation.
Transforming a percentage into a probability of victory is fairly easy. Convert a percentage into the log odds of the percentage, multiply that by some integer, and convert that back into a percentage.
By what integer should I multiply the log-odds(percentage)? The answer varies.
I first tried this out with Michigan’s presidential vote in 2012. Michigan is known, after all, to be a high-quality gerrymander on the federal level. The result, somewhat surprisingly, was that given low enough number the log-odds(percentage) is multiplied by [i.e., given high enough values of voter swinginess] it was the Democrats who were favored under that House map (i.e., the 2011 House map in MI was a dummymander), due to the safety of the Dem seats and the complete lack of safety of the Republicans’ seats (or so it appeared) that year.
The first row in the below table is the number the log-odds (percentage) was multiplied by to produce the estimated probabilities of victory in the below rows.
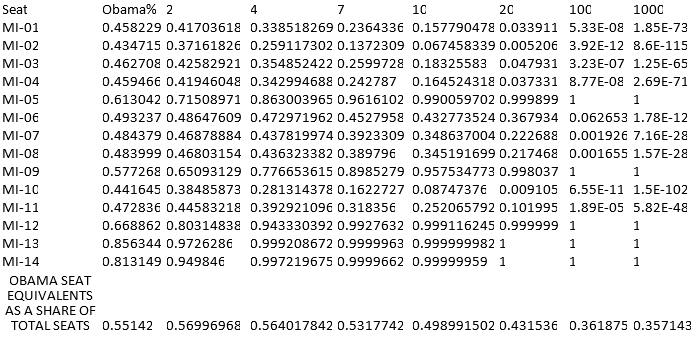
However, by the 2016 presidential election numbers, the Republicans became clearly favored due to the newfound safety of their seats and a newfound danger to the Dem seats:

Note: the two-party HRC percentage is listed as over 50% in the above table due to more Democratic districts having lower voter turnout, and each district being counted equally during averaging the vote.
The number one should multiply the log-odds percentage by remains to be debated with historical statistical evidence; but I would be surprised if it were not within the range of three to twenty.